Soiling losses calculation with PV SoilSayer
Calculate soiling loss:
The PV SoilSayer utilizes industry standard PV performance modeling software, combined with weather forecasts and PV system soiling estimations to calculate estimated losses, optimal cleaning schedules and net financial returns.
The PV SoilSayer is designed to give users full control over modeling the cost trade-offs associated with soiling. Users can choose from a number of different options for calculating soiling losses or uploading measured data. In addition, there several options for running different cleaning scenarios to better understand the cost trade-offs for a given clean cycle.
Calculate Annual Soiling Losses
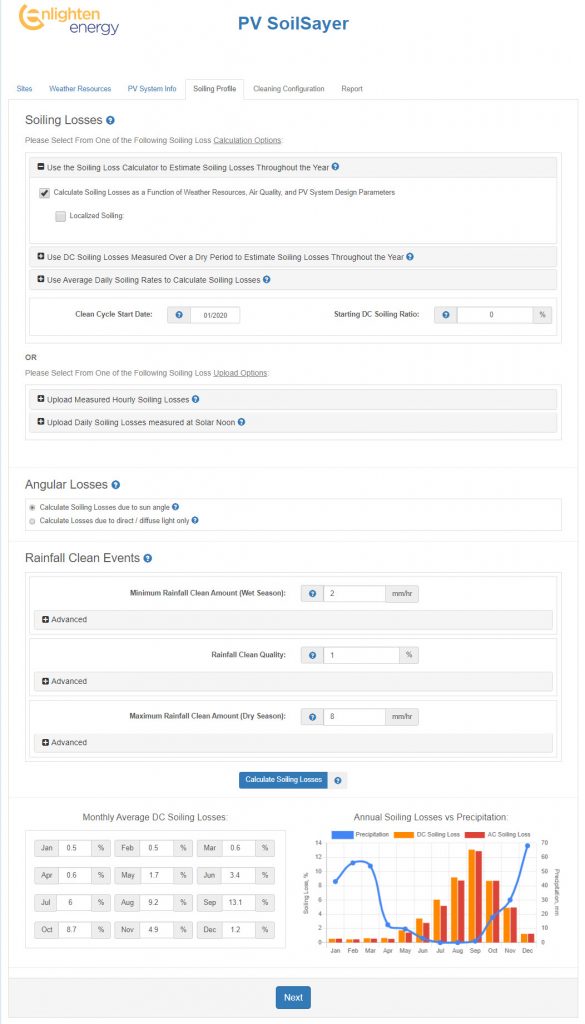
Users can select from a number of different soiling calculation options to estimate soiling losses throughout the year:
- Use the Soiling Loss Calculator to Estimate Soiling Losses Throughout the Year
- Use the Soiling Losses Measured over a Dry Period to Estimate Soiling Losses Throughout the Year
-
Use the Daily Average Soiling Rates to Estimate Soiling Losses Throughout the Year
-
Upload Annual Soiling Losses
Users can upload measured soiling losses in order to calculate losses throughout the year:
- Upload Measured Hourly Soiling Losses
-
Upload Measured Daily Soiling Losses
-
Clean Cycle Configurations
-
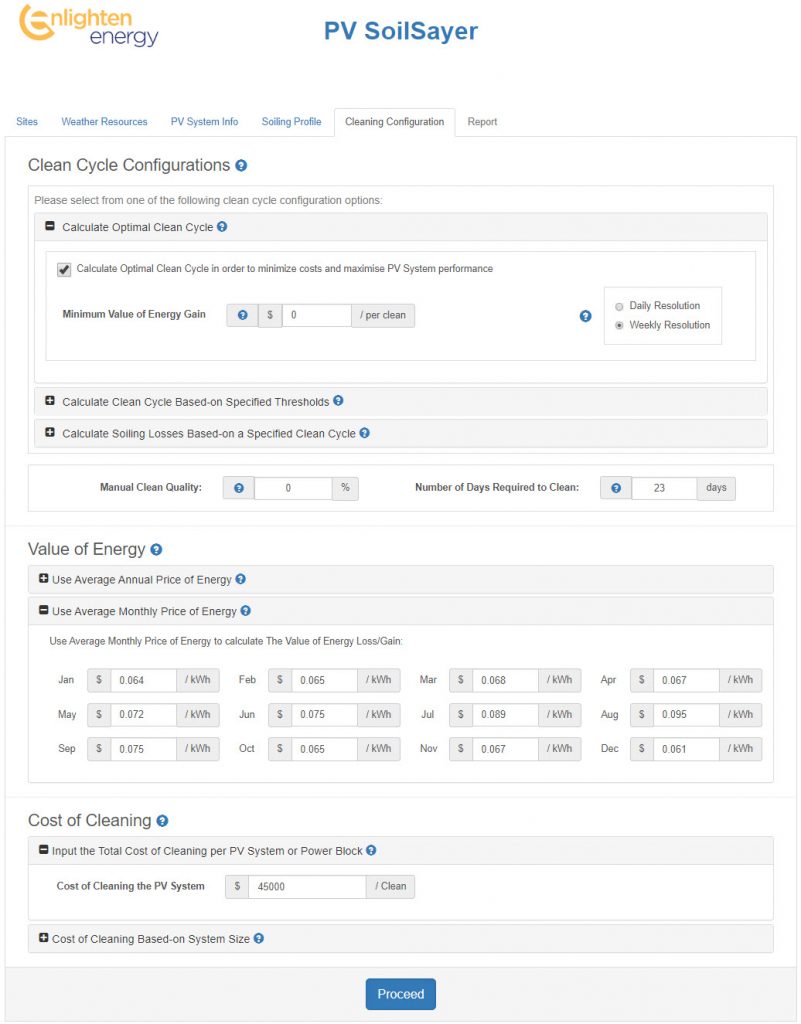
Users can select a number of different cleaning cycle configurations for calculating losses:
- Calculate the Clean Cycle based-on user specified thresholds
-
Clean when the Avg Daily soiling losses reach a specified threshold
-
Clean when the Financial losses due to soiling reach a specified threshold
-
Clean when the soiling losses at Solar Noon reach a specified threshold
-
Clean when the average daily soiling losses reach a specified threshold
- Calculate the losses and associated costs based-on a specified clean cycle
Detailed reports provide users with estimates of cost trade-offs associated with a specified clean cycle.
Users can compare soiling losses and associated costs, as well as the value of energy gain for a given clean cycle, in order to make informed decisions about the frequency and timing for cleaning the PV system.
Interactive charts provide users with valuable insights into daily, monthly, and annual precipitation patterns, soiling trends and associated losses.


